9 Linear & Logistic Regression
9.1 Types of machine learning
9.1.0.1 Supervised learning
The training data consists of input-output pairs , where:
= the input features
= the output label
The goal is to learn the true underlying relationship between
and
from these examples, so that when you see a new, unseen
,
you can correctly predict its
.
The real-life challenge is that the quality of a supervised learning
model is heavily dependent on the quality and quantity of labelled
data.
9.1.0.2 Unsupervised learning
The training data consists of only inputs
— there are no output labels
.
The model must find structure, patterns, or useful knowledge entirely on
its own.
9.2 Types of Supervised learning problems
9.2.0.1 Regression
The output is a continuous value - meaning it can take any real number within some range, rather than belonging to a fixed set of categories.
9.2.0.2 Classification
The output
is a discrete value - meaning it belongs to one of a fixed, finite set
of categories or classes.
Both types of problems have different loss functions and model
designs.
9.3 Linear Regression
The simplest form of regression problem is linear regression.
For an input data point
(meaning
is a vector of
numbers, i.e.
features), we predict its label
using
where
is the weight vector and each element
controls how much the
-th
feature of
contributes to the prediction. The bias parameter
shifts the entire prediction up or down regardless of
.
9.3.1 Basis functions
A limitation of the basic equation
is that it can only represent straight, linear functions.
We introduce basis functions
for
.
Instead of feeding the raw input
into a linear model, we first transform
using these basis functions, then apply a linear model to the
transformed features.
Note that the model remains linear with respect to its learnable weights
(),
meaning it is still computationally easy to train. However, it becomes
non-linear with respect to the original inputs
(),
allowing it to fit curved data.
9.3.1.1 Example - polynomial basis functions
If our input is 1D
(),
we can define our basis functions simply as powers of
:
.
Plugging this into the model:
9.4 Parameter Estimation for Linear Regression
Given the linear model and training data, how to find the best
possible set of weights?
Here, we assume bias
.
9.4.1 Least Squares Method (LSM)
Given a dataset of
training examples denoted as
for
, LSM attempts to find the optimal weight vector, denoted as
,
by minimizing the average squared difference between the model’s
predictions and the actual true labels.
Note that in standard Least Squares, the averaging factor of
is conventionally omitted from the formula, though it is usually
included in broader concepts like Empirical Risk Minimization.
Why squared error?
Always non-negative — errors above and below the true value don’t cancel each other out.
Penalises large errors more heavily.
Mathematically convenient — the squared function is smooth and differentiable everywhere, making it easy to minimise analytically.
In vector/matrix formulation, if we stack the
labels into a vector
,
and stack all input features into a matrix
,
we get
Because of this matrix formulation, if we assume that the
covariance-like matrix
is invertible, we can solve for the optimal weights directly without
iterative guessing. The exact, closed-form solution is:
This is derived by taking the gradient of
with respect to
,
setting it to zero, and solving.
is invertible when the columns of
are linearly independent. This means that
(i.e. at least as many training examples as features), and no redundant
features (i.e. no linear combination of another column).
If
is not invertible, the solution is not unique — multiple values of
give the same minimum loss.
9.4.2 MLE
MLE takes a probabilistic perspective rather than purely looking at
geometric errors. It assumes that there is some "true" unknown weight
, but the real-world labels we observe
()
are corrupted by random Gaussian noise.
Therefore, the rule generating our data is
We want to find the true weights
.
The probabilistic model of
that is normal distributed, centered at
,
with spread
is
Assuming the training examples are independent of each other given their
inputs, the joint probability of observing all labels
is:
Taking logarithm on both
sides,
The MLE problem is then:
Note that
The first term is a constant with respect to — it doesn’t affect which is optimal.
The second term is a negative scaled version of the LSM objective. Maximising the log-likelihood is exactly equivalent to minimising the sum of squared errors.
Hence, LSM and MLE under Gaussian give the same answer.
9.4.3 Other loss functions (not Gaussian)
The squared error formula
is entirely attributed to our assumption that the underlying noise is
Gaussian.
But what if the data has a different noise structure?
Assume the noise follows a Laplace distribution, defined as
The Laplace distribution has heavier tails — meaning it assigns higher
probability to values far from the mean. In practice this means it’s a
better model for data with outliers.
Following the same logic as before, the joint likelihood is:
Maximising the log-likelihood gives:
Dropping constants, we get
This simplifies to finding the weights that minimize the absolute error
instead of squared error.
The implication is that every choice of loss function corresponds to an
implicit assumption about the noise distribution in the data.
9.5 Overfitting & Regularisation
9.5.1 Overfitting
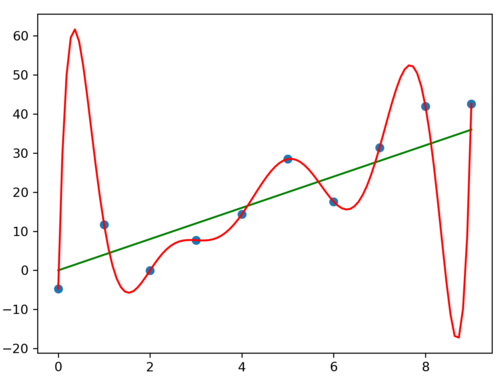
Increasing a model’s complexity (like using higher-degree polynomials) gives it more expressive power. If a model has a higher degree of freedom than the true function that generated the data, it can cause overfitting. In other words, the model learns not just the true underlying pattern in the data, but also the random noise specific to the training set. Graphically, an overfitted curve would try to hit every data point, causing aggressive fluctuations, and making a new prediction on unseen data would be inaccurate.
9.5.2 Ridge regression (-Regularisation)
To combat overfitting, we add a regularisation term to the LSM objective. This term penalises large parameter values, discouraging the model from becoming too complex and fitting the noise. The regularisation term consists of:
, the regularisation strength.
, the sum of squares of all the weights.
Recall that overfitting is caused by the model making wild swings
between data points, and this requires large weight values.
Hence, the model now has to balance two competing goals:
Minimising the squared error, and
keeping the weights as small as possible.
Just like standard LSM, Ridge regression has a closed-form
solution.
With
,
Recall that standard LSM requires
to be invertible, which fails when there aren’t enough training examples
or features are redundant. Adding
to
always makes the matrix invertible for any
,
since it shifts all eigenvalues away from zero. This means Ridge
regression is well-defined even when standard LSM breaks down.
9.5.2.1 Effect of regularisation strength
affects how much to penalise large weights.
No regularization (): This is just pure LSM with no penalty on weights, prone to overfitting.
Proper regularization ( at the right value): The model is constrained enough to ignore noise but flexible enough to capture the true shape. Strikes a good balance between training fit and generalisation
Strong regularization ( very large): The penalty on weight is too high, flattening the curve entirely into a straight line, leading to underfitting
In practice, might be chosen through cross-validation, i.e. testing different values of using training set and a validation set. is a hyperparameter, meaning it’s a parameter of the learning algorithm itself, not learned from the data directly like , but chosen by the user.
9.6 Bias-variance tradeoff
Recall the linear regression model:
for fixed input data points
,
for
.
The noise has mean of 0, variance of
,
and all the
are independent of each other.
From the training data, we train the model, and get an estimated set of
weights. This is the estimator
,
which is a function of the observed labels
.
The implication is that
is a random variable.
9.6.1 How good is the estimator ?
We measure the expected squared error:
This is the average squared difference between what the model predicts
()
and what the true prediction should be
().
By adding and subtracting
,
we get
Interpretation:
Variance term: This measures how much the model’s predictions fluctuate around its own mean due to noise in the underlying data. High variance means that different training datasets give very different values.
Bias squared term: This measures the difference between the model’s average prediction and the true underlying rule. If , we get an unbiased estimator.
Connection to overfitting/underfitting:
A simple model (high regularisation weight ) would have high bias (can’t capture the true patterns) and low variance (relatively stable across diff dataset).
A complex model (low ) would have low bias (model is flexible to fit to the data) and high variance (sensitive to noise).
In both cases, the total error is high. The goal is find the sweet spot that minimises their sum by choosing the right regularisation weight .
9.6.2 Performance of Ridge Regression
Recall the formula for Ridge Regression weights (our estimator,
):
Bias term
Since the true labels are generated by
,
subbing in,
Then taking expectation,
because
.
Note that
,
instead it depends on both
and
.
Since the bias is the difference between
and the truth
,
Variance
term
The variance for Ridge Regression estimator is
Therefore, for Ridge regression with -regularisation (), we have: Key observations:
(No regularisation): is the LSM/MLE estimator. Ridge regression reduces to just to standard LSM, which is equivalent to MLE under Gaussian noise.
, Variance , Total error .
This estimator is unbiased. The variance can be large if is large and is small (many parameters relative to data).
Hence is required for MLE/LSM to perform well.
Prone to overfitting.
(Strong regularisation): The estimator becomes useless.
, Variance , Total error .
To minimise the loss function, , so it predicts near 0 regardless of . The variance is thus near 0.
The bias is huge, as the predictions are consistently wrong.
Underfitting.
The role of and :
If , , variance , which is very small so LSM works well.
If , variance is large, so LSM doesn’t learn anything useful.
If , is not invertible so LSM has no unique solution. Ridge regression fixes this as () is always invertible, but at the cost of introducing bias.
Hence ridge regression trades some bias for a variance reduction, giving better total error.
9.6.3 The Bias-Variance Tradeoff Curve
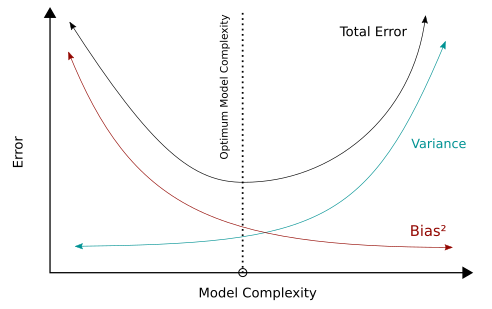
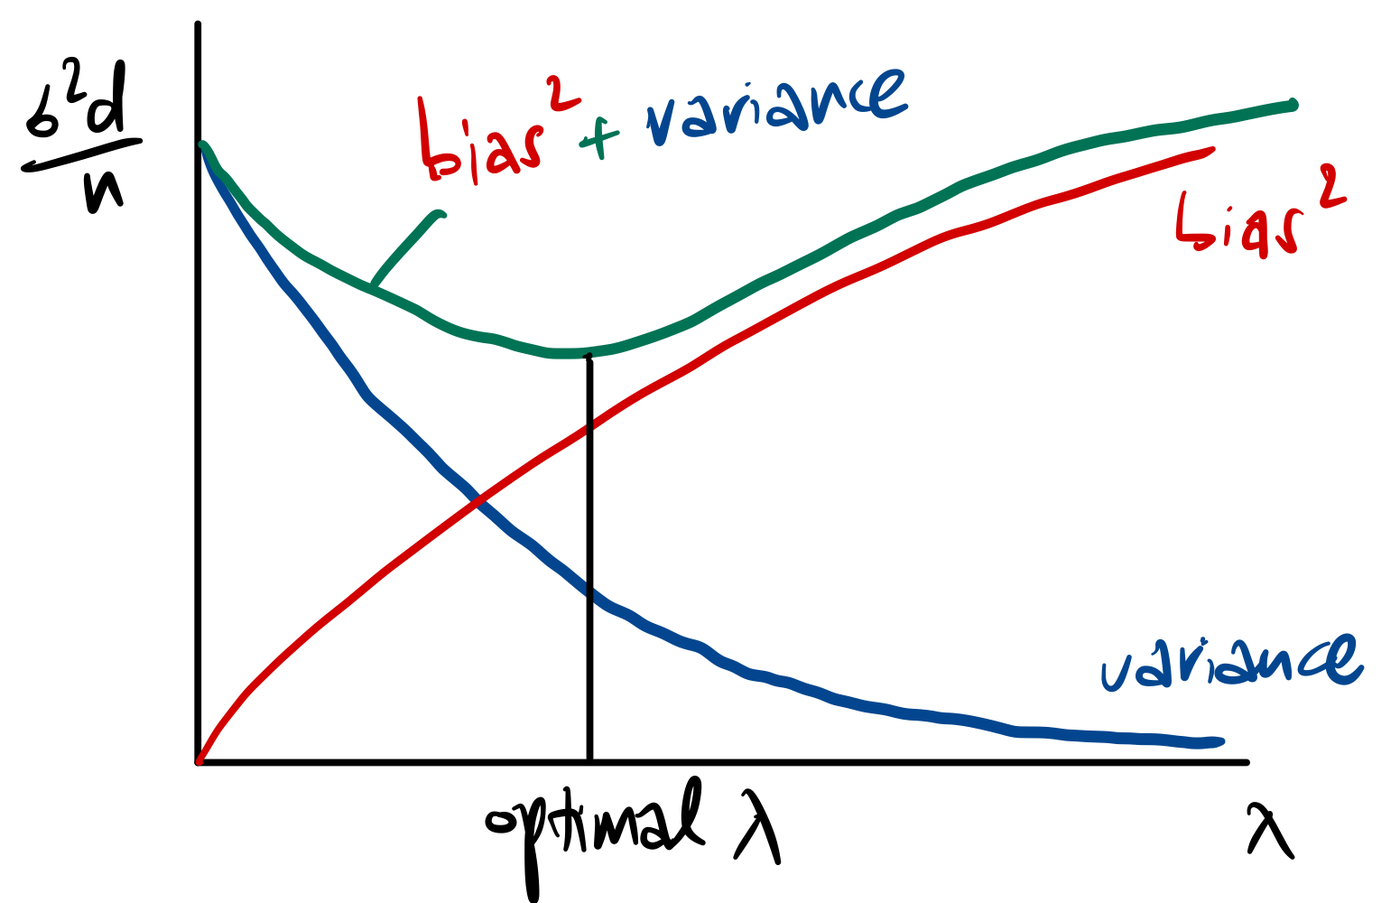
The goal is find that balances bias (underfitting) and variance (overfitting).
9.7 Logistic Regression
Despite its name, Logistic regression focuses on binary
classification problem. We are trying to predict a discrete outcome that
only has two possible states, mathematically represented as
.
We use a sigmoid function to squash a continuous output from the
standard linear regression model
(),
into a valid probability between 0 and 1. The sigmoid function is
Note that:
When is large and positive, .
When is large and negative, .
When , .
9.7.0.1 The probabilistic structure
For an input , and an unknown true parameter ,
The probability that the class is 1:
The probability that the class is -1:
9.7.0.2 The decision boundary
Note this critical equivalence:
Hence when
,
the probability of
is
,
so we can predict class of +1.
Conversely, when
,
the probability of
is
,
so we can predict class of -1.
is the decision boundary. Geometrically, it is a hyperplane in the input
space, dividing it into two sides.
9.7.0.3 Unifying the probabilistic structure
Combining the 2 probabiliy equations, We can check that:
When , .
When , .
9.7.1 MLE for Logistic Regression
Given training data for and assuming the training examples are independent, the MLE objective is to find Intuition behind this logistic loss:
When the prediction is correct and confident ( and have the same sign, large magnitude), we get , a small loss.
When the prediction is wrong and confident ( and have opposite signs, large magnitude), we get , a very large loss.
When the model is uncertain (), we get , a moderate loss.
To prevent overfitting, we can add
regularisation to obtain the final logistic regression objective:
Probabilistic framework: Logistic regression uses Bernoulli via sigmoid,
instead of Gaussian in linear regression.
Closed-form solution: Unlike linear/Ridge regression, logistic
regression does not have a closed-form analytical solution. The logistic
loss is not quadratic in
,
so we can’t simply set the gradient to zero and solve algebraically.
Instead, iterative numerical methods such as gradient descent must be
used to find
.
However, the objective is convex, which guarantees that iterative
methods will converge to the global minimum.